Press Releases
LEXINGTON, Ky., Aug. 4, 2021 /PRNewswire/ -- Valvoline Inc. (NYSE: VVV), a leading provider of automotive services and premium branded lubricants, today reported financial results for its third fiscal quarter ended June 30, 2021. All comparisons in this press release are made to the same prior-year period; however, comparisons to 2019 have also been included to normalize for the impacts of COVID-19.
"The strength of our team, brand and business model drove exceptional results this quarter, with operating income growing 28% and adjusted EBITDA growing 35% versus Q3 2019," said Sam Mitchell, CEO. "Our strategic transformation to a service-driven business continues to accelerate our growth, margins and earnings. In addition, secular growth of key industry drivers, such as vehicles in operation, miles driven and age of vehicles, continue to drive global demand for Valvoline's products and preventive maintenance services."
The Retail Services segment delivered much of the year-over-year growth this quarter with over 40% system-wide SSS growth and 10% system-wide unit growth while profitability more than doubled. Retail Services is forecasted to deliver 6 to 8% normalized SSS growth and 5 to 7% unit growth annually across the system over the Company's long-range plan through 2024.
Mitchell continued, "System-wide same-store sales increased 27% versus Q3 2019. We continue to gain share and expand average ticket, including ongoing growth in non-oil change revenue, highlighting the broad array of preventive maintenance services performed at our nearly 1,600 stores."
The Global Products segment delivered year-over-year sales growth of 46%, exceeding volume growth of 37%, demonstrating the pricing power of the business. Sales and volume grew 15% and 9%, respectively, versus Q3 2019. Operating income and adjusted EBITDA grew 16% and 17% year-over-year, respectively, and grew 6% and 3% versus 2019. Slower growth in profitability reflects the near-term impacts of rising raw material costs that the Company expects to recover over time.
"We expect our Global Products segment to deliver $200 million of discretionary free cash flow this fiscal year, highlighting the resilience of the business," said Mitchell. "Global Products is a strong cash generator for Valvoline with a strategic focus on driving market share growth globally by leveraging our 150-year-old brand and technology."
Business Realignment and Reporting Changes
As announced on May 18, 2021, Valvoline realigned its global operations and related reporting, beginning in the fiscal third quarter of 2021. Refer to the Basis of Presentation section below for further information.
Operating Segment Results
Retail Services
(In millions, except store count) | Q3 results | YoY growth | Growth from Q3 FY19 | ||||
Retail Services segment sales | $ | 330 | 66 | % | 56 | % | |
System-wide store sales (a) | $ | 526 | 51 | % | 44 | % | |
System-wide SSS (a) growth | N/A | 40.5 | % | 27.1 | % | ||
System-wide store count (a) | 1,569 | 10 | % | 16 | % | ||
Operating income | $ | 97 | 120 | % | 76 | % | |
Adjusted EBITDA (a) | $ | 112 | 107 | % | 78 | % | |
(a) Refer to Key Business Measures, Use of Non-GAAP Measures, and Table 4, Information by Operating Segment - Retail Services, for a description of the metrics presented above. |
Global Products
(In millions) | Q3 results | YoY growth | Growth from Q3 FY19 | ||||
Lubricant sales (gallons) (a) | 41.8 | 37 | % | 9 | % | ||
Global Products segment sales | $ | 462 | 46 | % | 15 | % | |
Operating income | $ | 72 | 16 | % | 6 | % | |
Adjusted EBITDA (a) | $ | 81 | 17 | % | 3 | % | |
Discretionary free cash flow (a) | $ | 53 | 20 | % | 2 | % | |
(a) Refer to Key Business Measures, Use of Non-GAAP Measures, and Table 5, Information by Operating Segment - Global Products, for a description of the metrics presented above. |
Balance Sheet and Cash Flow
- Total debt of approximately $1.7 billion and net debt of approximately $1.5 billion
- Year-to-date cash flow from operations of $296 million; discretionary free cash flow of $275 million; and free cash flow of $190 million
Outlook
"Our transformation is accelerating," Mitchell added. "Our cash generation is funding our continued shift to services, which we believe leads to sustainable shareholder value creation. We have invested nearly $330 million in acquisitions and capex so far this fiscal year to drive store growth, which we expect will generate strong returns. We are tightening the guidance that we announced at our recent business update call for adjusted EBITDA to $620 million to $640 million."
"Additionally, we expect to continue returning excess cash to shareholders via dividends and share repurchases using our recently announced $300 million share repurchase authorization."
Information regarding the Company's outlook for fiscal 2021 is provided in the table below:
Outlook | |
Operating Items | |
Sales growth | 25 - 26% |
Retail Services system-wide store additions | 140 - 160 |
Retail Services system-wide SSS growth | 19 - 21% |
Normalized1 system-wide SSS growth | 10 - 12% |
Adjusted EBITDA | $620 - $640 million |
Corporate Items | |
Adjusted effective tax rate | 25 - 26% |
Adjusted EPS | $1.86 - $1.96 |
Capital expenditures | $160 - $170 million |
Free cash flow | $250 - $270 million |
1 Same-store sales growth adjusted for estimated COVID-19 impacts in March - May 2020 period; based on | |
Valvoline's outlook for adjusted EBITDA, adjusted EPS and the adjusted effective tax rate are non-GAAP financial measures that are expected to be adjusted for items impacting comparability. Valvoline is unable to reconcile these forward-looking non-GAAP financial measures to GAAP net income and EPS estimated for fiscal 2021 without unreasonable efforts, as the Company is currently unable to predict with a reasonable degree of certainty the type and extent of certain items that would be expected to impact GAAP net income and EPS in fiscal 2021 but would not impact non-GAAP adjusted results.
Conference Call Webcast
Valvoline will host a live audio webcast of its fiscal third quarter 2021 conference call at 9 a.m. ET on Thursday, August 5, 2021. The webcast and supporting materials will be accessible through Valvoline's website at http://investors.valvoline.com. Following the live event, an archived version of the webcast and supporting materials will be available.
Basis of Presentation
Valvoline realigned its global operations and related reporting during the third quarter of fiscal 2021 to manage its business through two operating segments, Retail Services and Global Products. Prior period amounts presented herein have been recast to conform to the current presentation consistent with the realignment of Valvoline's global operations. These changes have no impact on the Company's historical consolidated GAAP balance sheets, statements of income or cash flows.
In addition, the Company adopted the current expected credit losses accounting standard, effective at the beginning of fiscal 2021 using the required modified retrospective approach. Under this approach, financial information related to periods prior to adoption were not adjusted and are presented as originally reported under the previous accounting guidance. The effects of adopting the new current expected credit losses standard were recognized as an adjustment that increased opening retained deficit by approximately $2 million. The Company expects the ongoing impacts will not be material to the consolidated financial statements.
Key Business Measures
Valvoline tracks its operating performance and manages its business using certain key measures, including system-wide, company-operated and franchised store counts and SSS; system-wide store sales; and lubricant volumes sold. Management believes these measures are useful to evaluating and understanding Valvoline's operating performance and should be considered as supplements to, not substitutes for, Valvoline's sales and operating income, as determined in accordance with U.S. GAAP.
Sales in the Retail Services reportable segment are influenced by the number of service center stores and the business performance of those stores. Stores are considered open upon acquisition or opening for business. Temporary store closings remain in the respective store counts with only permanent store closures reflected in the activity and end of period store counts. SSS is defined as sales by U.S. Retail Services stores (company-operated, franchised and the combination of these for system-wide SSS), with new stores, including franchised conversions, excluded from the metric until the completion of their first full fiscal year in operation as this period is generally required for new store sales levels to begin to normalize.
Retail Services sales are limited to sales at company-operated stores, sales of lubricants and other products to independent franchisees and Express Care operators and royalties and other fees from franchised stores. Although Valvoline does not recognize store-level sales from franchised stores as sales in its Statements of Consolidated Income, management believes system-wide and franchised SSS comparisons, store counts, and total system-wide store sales are useful to assess market position relative to competitors and overall store and segment operating performance.
Management believes lubricant volumes sold in gallons by its consolidated subsidiaries is a useful measure in evaluating and understanding the operating performance of the Global Products segment. Volumes sold in other units of measure, including liters, are converted to gallons utilizing standard conversions.
Use of Non-GAAP Measures
To supplement the financial measures prepared in accordance with U.S. GAAP, certain items within this press release are presented on an adjusted basis. These non-GAAP measures, presented on both a consolidated and operating segment basis, have limitations as analytical tools and should not be considered in isolation from, or as an alternative to, or more meaningful than, the financial results presented in accordance with U.S. GAAP. The financial results presented in accordance with U.S. GAAP and the reconciliations of non-GAAP measures should be carefully evaluated. The non-GAAP information used by management may not be comparable to similar measures disclosed by other companies, because of differing methods used in calculating such measures.
This press release includes the following non-GAAP measures: segment adjusted operating income, consolidated EBITDA, consolidated and segment adjusted EBITDA, consolidated adjusted net income and earnings per share, consolidated free cash flow, and consolidated and segment discretionary free cash flow. Refer to Tables 4-5 and 7-9 for management's definition of each non-GAAP measure and reconciliation to the most comparable U.S. GAAP measure.
Management believes the use of non-GAAP measures on a consolidated and operating segment basis provides a useful supplemental presentation of Valvoline's operating performance and allows for transparency with respect to key metrics used by management in operating the business and measuring performance. Management believes EBITDA measures provide a meaningful supplemental presentation of Valvoline's operating performance between periods on a comparable basis due to the depreciable assets associated with the nature of the Company's operations and interest costs related to Valvoline's capital structure.
Adjusted profitability measures enable comparison of financial trends and results between periods where certain items may vary independent of business performance. These adjusted measures exclude the impact of certain unusual, infrequent or non-operational activity not directly attributable to the underlying business, which management believes impacts the comparability of operational results between periods ("key items"). Key items are often related to legacy matters or market-driven events considered by management to not be reflective of the ongoing operating performance. Key items may consist of adjustments related to: legacy businesses, including the separation from Valvoline's former parent company and associated impacts of related indemnities; significant acquisitions or divestitures; restructuring-related matters; tax reform legislation; debt extinguishment and modification costs; and other matters that are non-operational or unusual in nature, including the following:
- Net pension and other postretirement plan expense/income - includes several elements impacted by changes in plan assets and obligations that are primarily driven by changes in the debt and equity markets, as well as those that are predominantly legacy in nature and related to prior service to the Company from employees (e.g., retirees, former employees and current employees with frozen benefits). These elements include (i) interest cost, (ii) expected return on plan assets, (iii) actuarial gains/losses, and (iv) amortization of prior service cost/credit. Significant factors that can contribute to changes in these elements include changes in discount rates used to remeasure pension and other postretirement obligations on an annual basis or upon a qualifying remeasurement, differences between actual and expected returns on plan assets, and other changes in actuarial assumptions, such as the life expectancy of plan participants. Accordingly, management considers that these elements may be more reflective of changes in current conditions in global financial markets (in particular, interest rates), outside the operational performance of the business, and are also primarily legacy amounts that are not directly related to the underlying business and do not have an immediate, corresponding impact on the compensation and benefits provided to eligible employees for current service. Adjusted profitability measures include the costs of benefits provided to employees for current service, including pension and other postretirement service costs.
- Changes in the last-in, first out (LIFO) inventory reserve - charges or credits recognized in Cost of sales to value certain lubricant inventories at the lower of cost or market using the LIFO method. During inflationary or deflationary pricing environments, the application of LIFO can result in variability of the cost of sales recognized each period as the most recent costs are matched against current sales, while preceding costs are retained in inventories. LIFO adjustments are determined based on published prices, which are difficult to predict and largely dependent on future events. The application of LIFO can impact comparability and enhance the lag period effects between changes in inventory costs and related pricing adjustments.
Management uses free cash flow and discretionary free cash flow as additional non-GAAP metrics of cash flow generation. By including capital expenditures and certain other adjustments, as applicable, management is able to provide an indication of the ongoing cash being generated that is ultimately available for both debt and equity holders as well as other investment opportunities. Free cash flow includes the impact of capital expenditures, providing a supplemental view of cash generation. Discretionary free cash flow includes maintenance capital expenditures, which are routine uses of cash that are necessary to maintain the Company's operations and provides a supplemental view of cash flow generation to maintain operations before discretionary investments in growth. Free cash flow and discretionary free cash flow have certain limitations, including that they do not reflect adjustments for certain non-discretionary cash flows, such as mandatory debt repayments. The amount of mandatory versus discretionary expenditures can vary significantly between periods.
About ValvolineTM
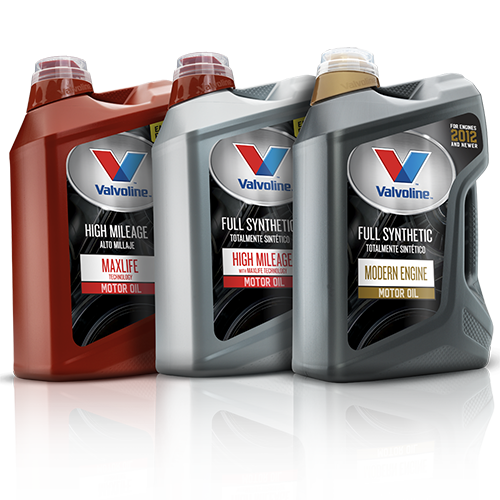
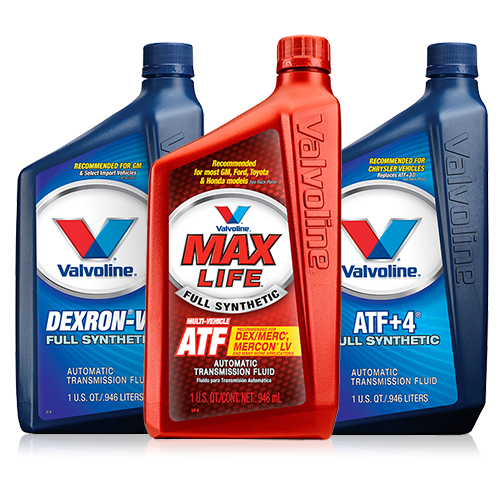
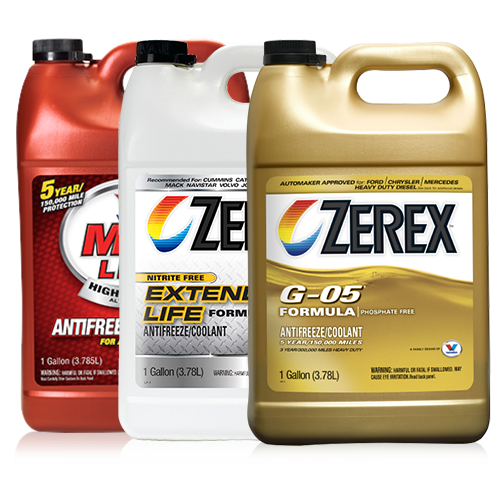
Valvoline Inc. (NYSE: VVV) is a leading provider of automotive services and marketer and supplier of premium branded lubricants worldwide, with sales in more than 140 countries. Established in 1866, the Company's heritage spans more than 150 years, during which time it has developed powerful brand recognition across multiple product and service channels. Valvoline operates and franchises more than 1,500 quick-lube locations and is the No. 2 chain by number of stores in the United States under the Valvoline Instant Oil ChangeSM brand and the No. 3 chain by number of stores in Canada under the Valvoline Great Canadian Oil Change brand. It also markets Valvoline lubricants and automotive chemicals, including Valvoline EV Performance Fluids; Valvoline Hybrid Vehicle Full Synthetic motor oil; Valvoline High Mileage with MaxLife technology motor oil for engines over 75,000 miles; Valvoline Advanced Full Synthetic motor oil; Valvoline Premium Blue™ heavy-duty motor oil; Valvoline Multi-Vehicle Automatic Transmission Fluid; and Zerex™ antifreeze. To learn more, visit www.valvoline.com.
Forward-Looking Statements
Certain statements in this press release, other than statements of historical fact, including estimates, projections and statements related to Valvoline's business plans and operating results, are forward-looking statements within the meaning of the Private Securities Litigation Reform Act of 1995. Valvoline has identified some of these forward-looking statements with words such as "anticipates," "believes," "expects," "estimates," "is likely," "predicts," "projects," "forecasts," "may," "will," "should" and "intends" and the negative of these words or other comparable terminology. These forward-looking statements are based on Valvoline's current expectations, estimates, projections and assumptions as of the date such statements are made and are subject to risks and uncertainties that may cause results to differ materially from those expressed or implied in the forward-looking statements. Additional information regarding these risks and uncertainties are described in the Company's filings with the Securities and Exchange Commission (the "SEC"), including in the "Risk Factors," "Management's Discussion and Analysis of Financial Condition and Results of Operations" and "Quantitative and Qualitative Disclosures about Market Risk" sections of Valvoline's most recently filed periodic reports on Forms 10-K and 10-Q, which are available on Valvoline's website at http://investors.valvoline.com/sec-filings or on the SEC's website at http://sec.gov. Valvoline assumes no obligation to update or revise these forward-looking statements for any reason, even if new information becomes available in the future, unless required by law.
TM Trademark, Valvoline or its subsidiaries, registered in various countries
SM Service mark, Valvoline or its subsidiaries, registered in various countries
FOR FURTHER INFORMATION
Sean T. Cornett
Sr. Director, Investor Relations
+1 (859) 357-2798
scornett@valvoline.com
Michele Gaither Sparks
Sr. Director, Corporate Communications
+1 (859) 230-8079
michele.sparks@valvoline.com
Valvoline Inc. and Consolidated Subsidiaries | Table 1 | ||||||||||
STATEMENTS OF CONSOLIDATED INCOME | |||||||||||
(In millions, except per share amounts - preliminary and unaudited) | |||||||||||
Three months ended | Nine months ended | ||||||||||
June 30 | June 30 | ||||||||||
2021 | 2020 | 2021 | 2020 | ||||||||
Sales | $ | 792 | $ | 516 | $ | 2,146 | $ | 1,701 | |||
Cost of sales | 533 | 329 | 1,412 | 1,096 | |||||||
GROSS PROFIT | 259 | 187 | 734 | 605 | |||||||
Selling, general and administrative expenses | 136 | 106 | 382 | 319 | |||||||
Net legacy and separation-related expenses | 1 | 1 | 2 | — | |||||||
Equity and other income, net | (9) | (8) | (36) | (23) | |||||||
OPERATING INCOME | 131 | 88 | 386 | 309 | |||||||
Net pension and other postretirement plan income | (14) | (9) | (41) | (27) | |||||||
Net interest and other financing expenses | 17 | 19 | 92 | 73 | |||||||
INCOME BEFORE INCOME TAXES | 128 | 78 | 335 | 263 | |||||||
Income tax expense | 31 | 19 | 83 | 68 | |||||||
NET INCOME | $ | 97 | $ | 59 | $ | 252 | $ | 195 | |||
NET EARNINGS PER SHARE | |||||||||||
BASIC | $ | 0.53 | $ | 0.32 | $ | 1.38 | $ | 1.04 | |||
DILUTED | $ | 0.53 | $ | 0.32 | $ | 1.37 | $ | 1.04 | |||
WEIGHTED AVERAGE COMMON SHARES OUTSTANDING | |||||||||||
BASIC | 182 | 186 | 183 | 187 | |||||||
DILUTED | 183 | 186 | 184 | 188 | |||||||
Valvoline Inc. and Consolidated Subsidiaries | Table 2 | ||||||
CONDENSED CONSOLIDATED BALANCE SHEETS | |||||||
(In millions - preliminary and unaudited) | |||||||
June 30 | September 30 | ||||||
2021 | 2020 | ||||||
ASSETS | |||||||
Current assets | |||||||
Cash and cash equivalents | $ | 226 | $ | 760 | |||
Receivables, net | 490 | 433 | |||||
Inventories, net | 247 | 199 | |||||
Prepaid expenses and other current assets | 53 | 46 | |||||
Total current assets | 1,016 | 1,438 | |||||
Noncurrent assets | |||||||
Property, plant and equipment, net | 773 | 613 | |||||
Operating lease assets | 311 | 261 | |||||
Goodwill and intangibles, net | 773 | 529 | |||||
Equity method investments | 47 | 44 | |||||
Deferred income taxes | 10 | 34 | |||||
Other noncurrent assets | 119 | 132 | |||||
Total noncurrent assets | 2,033 | 1,613 | |||||
Total assets | $ | 3,049 | $ | 3,051 | |||
LIABILITIES AND STOCKHOLDERS' EQUITY (DEFICIT) | |||||||
Current liabilities | |||||||
Current portion of long-term debt | $ | 2 | $ | — | |||
Trade and other payables | 216 | 189 | |||||
Accrued expenses and other liabilities | 289 | 255 | |||||
Total current liabilities | 507 | 444 | |||||
Noncurrent liabilities | |||||||
Long-term debt | 1,691 | 1,962 | |||||
Employee benefit obligations | 272 | 317 | |||||
Operating lease liabilities | 276 | 231 | |||||
Other noncurrent liabilities | 280 | 173 | |||||
Total noncurrent liabilities | 2,519 | 2,683 | |||||
Stockholders' equity (deficit) | 23 | (76) | |||||
Total liabilities and stockholders' equity (deficit) | $ | 3,049 | $ | 3,051 | |||
Valvoline Inc. and Consolidated Subsidiaries | Table 3 | |||||||
STATEMENTS OF CONSOLIDATED CASH FLOWS | ||||||||
(In millions - preliminary and unaudited) | ||||||||
Nine months ended | ||||||||
June 30 | ||||||||
2021 | 2020 | |||||||
CASH FLOWS FROM OPERATING ACTIVITIES | ||||||||
Net income | $ | 252 | $ | 195 | ||||
Adjustments to reconcile net income to cash flows from operating activities | ||||||||
Loss on extinguishment of debt | 36 | 19 | ||||||
Depreciation and amortization | 68 | 48 | ||||||
Deferred income taxes | 24 | — | ||||||
Pension contributions | (4) | (9) | ||||||
Stock-based compensation expense | 10 | 8 | ||||||
Other, net | 1 | 1 | ||||||
Change in operating assets and liabilities | (91) | 9 | ||||||
Total cash provided by operating activities | 296 | 271 | ||||||
CASH FLOWS FROM INVESTING ACTIVITIES | ||||||||
Additions to property, plant and equipment | (106) | (94) | ||||||
Notes receivable, net | 14 | (31) | ||||||
Acquisitions of businesses, net of cash acquired | (267) | (18) | ||||||
Other investing activities, net | 8 | — | ||||||
Total cash used in investing activities | (351) | (143) | ||||||
CASH FLOWS FROM FINANCING ACTIVITIES | ||||||||
Proceeds from borrowings | 555 | 1,547 | ||||||
Payments of debt issuance costs and discounts | (7) | (16) | ||||||
Repayments on borrowings | (829) | (925) | ||||||
Premium paid to extinguish debt | (26) | (15) | ||||||
Repurchases of common stock | (100) | (60) | ||||||
Cash dividends paid | (69) | (63) | ||||||
Other financing activities | (7) | (3) | ||||||
Total cash (used in) provided by financing activities | (483) | 465 | ||||||
Effect of currency exchange rate changes on cash, cash equivalents, and restricted cash | 5 | (1) | ||||||
(DECREASE) INCREASE IN CASH, CASH EQUIVALENTS, AND RESTRICTED CASH | (533) | 592 | ||||||
Cash, cash equivalents, and restricted cash - beginning of period | 761 | 159 | ||||||
CASH, CASH EQUIVALENTS, AND RESTRICTED CASH - END OF PERIOD | $ | 228 | $ | 751 | ||||
Valvoline Inc. and Consolidated Subsidiaries | Table 4 | |||||||||||||||||||||||
INFORMATION BY OPERATING SEGMENT - RETAIL SERVICES | ||||||||||||||||||||||||
(In millions, except store counts - preliminary and unaudited) | ||||||||||||||||||||||||
Three months ended | Nine months ended | |||||||||||||||||||||||
June 30 | June 30 | |||||||||||||||||||||||
2021 | 2020 | 2019 | 2021 | 2020 | 2019 | |||||||||||||||||||
Sales information | ||||||||||||||||||||||||
Retail Services segment sales | $ | 330 | $ | 199 | $ | 211 | $ | 869 | $ | 629 | $ | 600 | ||||||||||||
Year-over-year growth | 66 | % | (6) | % | 26 | % | 38 | % | 5 | % | 25 | % | ||||||||||||
System-wide store sales (a) | $ | 526 | $ | 348 | $ | 365 | $ | 1,415 | $ | 1,090 | $ | 1,039 | ||||||||||||
Year-over-year growth (a) | 51 | % | (5) | % | 25 | % | 30 | % | 5 | % | 24 | % | ||||||||||||
Same-store sales growth (b) | ||||||||||||||||||||||||
Company-operated | 36.1 | % | (5.2) | % | 9.1 | % | 20.4 | % | 0.3 | % | 9.7 | % | ||||||||||||
Franchised (a) | 43.9 | % | (9.9) | % | 10.0 | % | 22.5 | % | 0.0 | % | 10.4 | % | ||||||||||||
System-wide (a) | 40.5 | % | (8.0) | % | 9.7 | % | 21.6 | % | 0.2 | % | 10.1 | % | ||||||||||||
Profitability information | ||||||||||||||||||||||||
Operating income (c) | $ | 97 | $ | 44 | $ | 55 | $ | 233 | $ | 142 | $ | 149 | ||||||||||||
Key items | — | — | — | — | — | — | ||||||||||||||||||
Adjusted operating income (c) | 97 | 44 | 55 | 233 | 142 | 149 | ||||||||||||||||||
Depreciation and amortization | 15 | 10 | 8 | 44 | 28 | 24 | ||||||||||||||||||
Adjusted EBITDA (c) | $ | 112 | $ | 54 | $ | 63 | $ | 277 | $ | 170 | $ | 173 | ||||||||||||
Adjusted EBITDA margin (d) | 33.9 | % | 27.1 | % | 29.9 | % | 31.9 | % | 27.0 | % | 28.8 | % | ||||||||||||
Discretionary cash flow information | ||||||||||||||||||||||||
Adjusted operating income (c) | $ | 97 | $ | 44 | $ | 55 | $ | 233 | $ | 142 | $ | 149 | ||||||||||||
Income tax expense (e) | (23) | (11) | (13) | (58) | (36) | (37) | ||||||||||||||||||
Maintenance additions to property, plant and equipment | (5) | (2) | (2) | (12) | (6) | (5) | ||||||||||||||||||
Discretionary free cash flow (f) | $ | 69 | $ | 31 | $ | 40 | $ | 163 | $ | 100 | $ | 107 | ||||||||||||
(a) | Measure includes Valvoline franchisees, which are independent legal entities. Valvoline does not consolidate the results of operations of its franchisees. | |||||||||||||||||||||||
(b) | Beginning in fiscal 2021, Valvoline determines SSS growth as sales by U.S. Retail Services stores, with new stores, including franchised conversions, excluded from the metric until the completion of their first full fiscal year in operation. Previously, SSS growth was determined as sales by U.S. Retail Services stores, with stores new to the U.S. Retail Services system excluded from the metric until completion of their first full year in operation. Prior period measures have been revised to conform to the current basis of presentation. | |||||||||||||||||||||||
(c) | Segment adjusted operating income is segment operating income adjusted for key items impacting comparability. Segment adjusted operating income is further adjusted for depreciation and amortization to determine segment adjusted EBITDA. Valvoline does not generally allocate activity below operating income to its operating segments; therefore, the table above reconciles operating income to Adjusted EBITDA. | |||||||||||||||||||||||
(d) | Adjusted EBITDA margin is calculated as Adjusted EBITDA divided by segment sales. | |||||||||||||||||||||||
(e) | Income tax expense estimated using the adjusted effective tax rate for the period multiplied by operating segment adjusted operating income. | |||||||||||||||||||||||
(f) | Segment discretionary free cash flow is defined as operating segment adjusted operating income after-tax less maintenance capital expenditures. | |||||||||||||||||||||||
Valvoline Inc. and Consolidated Subsidiaries | Table 5 | |||||||||||||||||||||||
INFORMATION BY OPERATING SEGMENT - GLOBAL PRODUCTS | ||||||||||||||||||||||||
(In millions - preliminary and unaudited) | ||||||||||||||||||||||||
Three months ended | Nine months ended | |||||||||||||||||||||||
June 30 | June 30 | |||||||||||||||||||||||
2021 | 2020 | 2019 | 2021 | 2020 | 2019 | |||||||||||||||||||
Volume information | ||||||||||||||||||||||||
Lubricant sales (gallons) | 41.8 | 30.5 | 38.4 | 119.7 | 101.2 | 111.3 | ||||||||||||||||||
Sales information | ||||||||||||||||||||||||
Sales by geographic region | ||||||||||||||||||||||||
North America (a) | $ | 278 | $ | 207 | $ | 260 | $ | 755 | $ | 693 | $ | 735 | ||||||||||||
Europe, Middle East and Africa ("EMEA") | 56 | 34 | 43 | 161 | 125 | 134 | ||||||||||||||||||
Asia Pacific | 96 | 65 | 72 | 267 | 193 | 212 | ||||||||||||||||||
Latin America (a) | 32 | 11 | 27 | 94 | 61 | 80 | ||||||||||||||||||
Global Products segment sales | $ | 462 | $ | 317 | $ | 402 | $ | 1,277 | $ | 1,072 | $ | 1,161 | ||||||||||||
Profitability information | ||||||||||||||||||||||||
Operating income (b) | $ | 72 | $ | 62 | $ | 68 | $ | 233 | $ | 199 | $ | 193 | ||||||||||||
Key items | — | — | 5 | — | — | 6 | ||||||||||||||||||
Adjusted operating income (b) | 72 | 62 | 73 | 233 | 199 | 199 | ||||||||||||||||||
Depreciation and amortization | 9 | 7 | 6 | 22 | 19 | 18 | ||||||||||||||||||
Adjusted EBITDA (b) | $ | 81 | $ | 69 | $ | 79 | $ | 255 | $ | 218 | $ | 217 | ||||||||||||
Adjusted EBITDA margin (c) | 17.5 | % | 21.8 | % | 19.7 | % | 20.0 | % | 20.3 | % | 18.7 | % | ||||||||||||
Discretionary cash flow information | ||||||||||||||||||||||||
Adjusted operating income (b) | $ | 72 | $ | 62 | $ | 73 | $ | 233 | $ | 199 | $ | 199 | ||||||||||||
Income tax expense (d) | (17) | (15) | (18) | (58) | (50) | (50) | ||||||||||||||||||
Maintenance additions to property, plant and equipment | (2) | (3) | (3) | (7) | (7) | (4) | ||||||||||||||||||
Discretionary free cash flow (e) | $ | 53 | $ | 44 | $ | 52 | $ | 168 | $ | 142 | $ | 145 | ||||||||||||
(a) | Valvoline includes the United States and Canada in its North America region. Mexico is included within the Latin America region. | |||||||||||||||||||||||
(b) | Segment adjusted operating income is segment operating income adjusted for key items impacting comparability. Segment adjusted operating income is further adjusted for depreciation and amortization to determine segment adjusted EBITDA. Valvoline does not generally allocate activity below operating income to its operating segments; therefore, the table above reconciles operating income to Adjusted EBITDA. | |||||||||||||||||||||||
(c) | Adjusted EBITDA margin is calculated as Adjusted EBITDA divided by segment sales. | |||||||||||||||||||||||
(d) | Income tax expense estimated using the adjusted effective tax rate for the period multiplied by operating segment adjusted operating income. | |||||||||||||||||||||||
(e) | Segment discretionary free cash flow is defined as operating segment adjusted operating income after-tax less maintenance capital expenditures. | |||||||||||||||||||||||
Valvoline Inc. and Consolidated Subsidiaries | Table 6 | |||||||||||||||
RETAIL SERVICES STORE INFORMATION | ||||||||||||||||
(Preliminary and unaudited) | ||||||||||||||||
System-wide stores (a) | ||||||||||||||||
Third | Second | First | Fourth | Third | ||||||||||||
Beginning of period | 1,548 | 1,533 | 1,462 | 1,432 | 1,419 | |||||||||||
Opened | 17 | 13 | 18 | 29 | 13 | |||||||||||
Acquired | 5 | 3 | 54 | 2 | 2 | |||||||||||
Closed | (1) | (1) | (1) | (1) | (2) | |||||||||||
End of period (b) | 1,569 | 1,548 | 1,533 | 1,462 | 1,432 | |||||||||||
Number of stores at end of period | ||||||||||||||||
Third | Second | First | Fourth | Third | ||||||||||||
Company-operated | 698 | 673 | 663 | 584 | 548 | |||||||||||
Franchised (b) | 871 | 875 | 870 | 878 | 884 | |||||||||||
June 30 | ||||||||||||||||
2021 | 2020 | 2019 | ||||||||||||||
System-wide store count (a) (b) | 1,569 | 1,432 | 1,352 | |||||||||||||
Year-over-year growth | 10% | 6% | 17% | |||||||||||||
(a) | System-wide store count includes franchised service center stores. Valvoline franchises are independent legal entities, and Valvoline does not consolidate the results of operations of its franchisees. |
(b) | Certain franchised service center stores temporarily closed at the discretion of the respective independent operators due to the impacts of COVID-19 and are included in the store counts at the end of the third and fourth quarters of fiscal 2020. As of June 30, 2020, 5 franchised service center stores were temporarily closed and 1 was as of September 30, 2020. No service center stores were temporarily closed as of June 30, 2021, March 31, 2021, or December 31, 2020. |
Valvoline Inc. and Consolidated Subsidiaries | Table 7 | |||||||||||
RECONCILIATION OF NON-GAAP DATA - NET INCOME AND DILUTED EARNINGS PER SHARE | ||||||||||||
(In millions, except per share amounts - preliminary and unaudited) | ||||||||||||
Three months ended | Nine months ended | |||||||||||
June 30 | June 30 | |||||||||||
2021 | 2020 | 2021 | 2020 | |||||||||
Reported net income | $ | 97 | $ | 59 | $ | 252 | $ | 195 | ||||
Adjustments: | ||||||||||||
Net pension and other postretirement plan income | (14) | (9) | (41) | (27) | ||||||||
Net legacy and separation-related expenses | 1 | 1 | 2 | — | ||||||||
LIFO charge (credit) | 17 | (7) | 26 | (12) | ||||||||
Debt extinguishment and modification costs | — | — | 36 | 19 | ||||||||
Business interruption recovery | — | — | (3) | — | ||||||||
Acquisition and divestiture-related costs | — | — | — | 2 | ||||||||
Restructuring and related expenses | — | — | — | 1 | ||||||||
Total adjustments, pre-tax | 4 | (15) | 20 | (17) | ||||||||
Income tax (expense) benefit of adjustments | (1) | 4 | (5) | 4 | ||||||||
Income tax adjustments (a) | — | — | — | 2 | ||||||||
Total adjustments, after tax | 3 | (11) | 15 | (11) | ||||||||
Adjusted net income (b) | $ | 100 | $ | 48 | $ | 267 | $ | 184 | ||||
Reported diluted earnings per share | $ | 0.53 | $ | 0.32 | $ | 1.37 | $ | 1.04 | ||||
Adjusted diluted earnings per share (c) | $ | 0.55 | $ | 0.26 | $ | 1.45 | $ | 0.98 | ||||
Weighted average diluted common shares outstanding | 183 | 186 | 184 | 188 | ||||||||
(a) | Income tax adjustments relate to the discrete impacts associated with tax legislation changes in India. | |||||||||||||||
(b) | Adjusted net income is defined as net income adjusted for key items. Refer to "Use of Non-GAAP Measures" in this press release for management's definition of key items. | |||||||||||||||
(c) | Adjusted diluted earnings per share is defined as earnings per diluted share calculated using adjusted net income. | |||||||||||||||
Valvoline Inc. and Consolidated Subsidiaries | Table 8 | |||||||||||
RECONCILIATION OF NON-GAAP DATA - ADJUSTED EBITDA | ||||||||||||
(In millions - preliminary and unaudited) | ||||||||||||
Three months ended | Nine months ended | |||||||||||
June 30 | June 30 | |||||||||||
2021 | 2020 | 2021 | 2020 | |||||||||
Adjusted EBITDA - Valvoline | ||||||||||||
Net income | $ | 97 | $ | 59 | $ | 252 | $ | 195 | ||||
Add: | ||||||||||||
Income tax expense | 31 | 19 | 83 | 68 | ||||||||
Net interest and other financing expenses | 17 | 19 | 92 | 73 | ||||||||
Depreciation and amortization | 24 | 17 | 68 | 48 | ||||||||
EBITDA (a) | 169 | 114 | 495 | 384 | ||||||||
Key items: | ||||||||||||
Net pension and other postretirement plan income | (14) | (9) | (41) | (27) | ||||||||
Net legacy and separation-related expenses | 1 | 1 | 2 | — | ||||||||
LIFO charge (credit) | 17 | (7) | 26 | (12) | ||||||||
Business interruption recovery | — | — | (3) | — | ||||||||
Acquisition and divestiture-related costs | — | — | — | 2 | ||||||||
Restructuring and related expenses | — | — | — | 1 | ||||||||
Key items - subtotal | 4 | (15) | (16) | (36) | ||||||||
Adjusted EBITDA (a) | $ | 173 | $ | 99 | $ | 479 | $ | 348 | ||||
Segment Adjusted EBITDA | ||||||||||||
Retail Services | $ | 112 | $ | 54 | $ | 277 | $ | 170 | ||||
Global Products | 81 | 69 | 255 | 218 | ||||||||
Segment Adjusted EBITDA (b) | 193 | 123 | 532 | 388 | ||||||||
Corporate | (20) | (24) | (53) | (40) | ||||||||
Total Adjusted EBITDA (a) | 173 | 99 | 479 | 348 | ||||||||
Net interest and other financing expenses | (17) | (19) | (92) | (73) | ||||||||
Depreciation and amortization | (24) | (17) | (68) | (48) | ||||||||
Key items | (4) | 15 | 16 | 36 | ||||||||
Income before income taxes | $ | 128 | $ | 78 | $ | 335 | $ | 263 | ||||
(a) | EBITDA is defined as net income, plus income tax expense, net interest and other financing expenses, and depreciation and amortization. Adjusted EBITDA is EBITDA adjusted for key items, as described in "Use of Non-GAAP Measures" within this press release. |
(b) | Segment adjusted EBITDA represents the operations of the Company's two operating segments, including expenses associated with each segment's utilization of indirect resources. The costs of corporate functions, in addition to corporate and non-operational matters, or key items, are not included in segment adjusted EBITDA. The table above reconciles segment adjusted EBITDA to consolidated pre-tax income. |
Valvoline Inc. and Consolidated Subsidiaries | Table 9 | |||||||
RECONCILIATION OF NON-GAAP DATA - FREE CASH FLOWS | ||||||||
(In millions - preliminary and unaudited) | ||||||||
Nine months ended | ||||||||
June 30 | ||||||||
Free cash flow (a) | 2021 | 2020 | ||||||
Total cash flows provided by operating activities | $ | 296 | $ | 271 | ||||
Adjustments: | ||||||||
Additions to property, plant and equipment | (106) | (94) | ||||||
Free cash flow | $ | 190 | $ | 177 | ||||
Nine months ended | ||||||||
June 30 | ||||||||
Discretionary free cash flow (b) | 2021 | 2020 | ||||||
Total cash flows provided by operating activities | $ | 296 | $ | 271 | ||||
Adjustments: | ||||||||
Maintenance additions to property, plant and equipment | (21) | (19) | ||||||
Discretionary free cash flow | $ | 275 | $ | 252 | ||||
Fiscal year | ||||||||
Free cash flow (a) | 2021 Outlook | |||||||
Total cash flows provided by operating activities | $420 - $430 | |||||||
Adjustments: | ||||||||
Additions to property, plant and equipment | (160 - 170) | |||||||
Free cash flow | $250 - $270 | |||||||
(a) | Free cash flow is defined as cash flows from operating activities less capital expenditures and certain other adjustments as applicable. |
(b) | Discretionary free cash flow is defined as cash flows from operating activities less maintenance capital expenditures and certain other adjustments as applicable. |
SOURCE Valvoline Inc.

 Motor Oil
 Grease & Gear Oil
 Automatic Transmission
 Antifreeze & Radiator
 Pro-V Racing
 Heavy Duty


 Download this Press Release